
In an idle moment a while ago I wrote a program to generate "factorization diagrams". Here’s 700:

It’s easy to see (I hope), just by looking at the arrangement of dots, that there are 
Here’s how I did it. First, a few imports: a function to do factorization of integers, and a library to draw pictures (yes, this is the library I wrote myself; I promise to write more about it soon!).
> module Factorization where
>
> import Math.NumberTheory.Primes.Factorisation (factorise)
>
> import Diagrams.Prelude
> import Diagrams.Backend.Cairo.CmdLine
>
> type Picture = Diagram Cairo R2
The primeLayout function takes an integer n (assumed to be a prime number) and some sort of picture, and symmetrically arranges n copies of the picture.
> primeLayout :: Integer -> Picture -> Picture
There is a special case for 2: if the picture is wider than tall, then we put the two copies one above the other; otherwise, we put them next to each other. In both cases we also add some space in between the copies (equal to half the height or width, respectively).
> primeLayout 2 d
>   | width d > height d = d === strutY (height d / 2) === d
>   | otherwise          = d ||| strutX (width d / 2)  ||| d
This means when there are multiple factors of two and we call primeLayout repeatedly, we end up with things like

If we always put the two copies (say) next to each other, we would get

which is much clunkier and harder to understand at a glance.
For other primes, we create a regular polygon of the appropriate size (using some trig I worked out on a napkin, don’t ask me to explain it) and position copies of the picture at the polygon’s vertices.
> primeLayout p d = decoratePath pts (repeat d)
>   where pts = polygon with { polyType   = PolyRegular (fromIntegral p) r
>                            , polyOrient = OrientH
>                            }
>         w = max (width d) (height d)
>         r = w * c / sin (tau / (2 * fromIntegral p))
>         c = 0.75
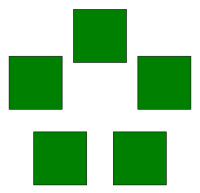
For example, here’s primeLayout 5 applied to a green square:
Now, given a list of prime factors, we recursively generate an entire picture as follows. First, if the list of prime factors is empty, that represents the number 1, so we just draw a black dot.
> factorDiagram' :: [Integer] -> Diagram Cairo R2
> factorDiagram' []     = circle 1 # fc black

Otherwise, if the first prime is called p and the rest are ps, we recursively generate a picture from the rest of the primes ps, and then lay out p copies of that picture using the primeLayout function.
> factorDiagram' (p:ps) = primeLayout p (factorDiagram' ps) # centerXY
Finally, to turn a number into its factorization diagram, we factorize it, normalize the returned factorization into a list of primes, reverse it so the bigger primes come first, and call factorDiagram'.
> factorDiagram :: Integer -> Diagram Cairo R2
> factorDiagram = factorDiagram'
>               . reverse
>               . concatMap (uncurry $ flip replicate)
>               . factorise
And voila! Of course, this really only works well for numbers with prime factors drawn from the set 


Are there 11 dots in those circles? 13? I can’t really tell at a glance. And here’s 611:

Uhh… well, at least it’s pretty!
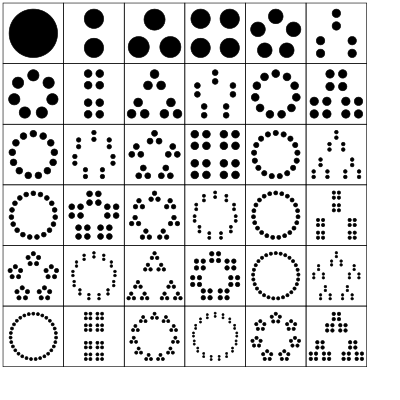
Here are the factorization diagrams for all the integers from 1 to 36:
Powers of three are especially fun, since their factorization diagrams are Sierpinski triangles! For example, here’s 

Powers of two are also fun. Here’s 

[ETA: as anon points out, this fractal has a name too: Cantor dust!]
One last one: 104.

I wish I knew how to make a website where you could enter a number and have it show you the factorization diagram… maybe eventually.
(In case you were wondering, 

I know what I’m doing this weekend. This is great!
Reblogged this on nebusresearch and commented:
The Math Less Traveled over here shows off a lovely way of visualizing the factoring of integers by putting them into patterns inspired by the regular polygons. Some numbers factor into wonderfully obvious patterns; some turn into muddles of dots because integers just work that way. They’re all attractive ways to look at numbers, though.
Powers of two look like http://en.wikipedia.org/wiki/Cantor_dust#Cantor_dust
Exactly, I also thought about fractals with the powers of 3.
Those are Sierpinski fractals. https://en.wikipedia.org/wiki/Sierpinski_triangle
The Sierpinski fractals are connected; the fractals the program gives aren’t. (They are merely Sierpinski-looking embeddings of the Cantor space). There even exists a homeomorphism of R^2 sending the Cantor dust to them.
Can you elaborate? What does that homeomorphism do?
Wow, that’s pretty. There should be a big poster version of this in every elementary school classroom.
Yes, but with more color! =D I haven’t come up with a good (meaningful) way to incorporate color into these diagrams. Somehow I want to assign a color to each prime, sort of like http://sonderbooks.com/blog/?p=843, except in my diagrams each dot represents 1, not a prime factor, so the dots themselves can’t really be colored.
You could draw one big centered colored circle in the background in primeLayout.
Good idea!
Yup, I get my students to make rectangles of various sizes in teams for the numbers 1 to 100, and then they get the idea about factors and numbers that have only two factors.
These patterns give me the prime factor decomposition as well.
That’s pretty neat. It reminds me a lot of the book “You Can Count on Monsters” which is less automated drawing, and of course, with more monsters. I’m looking forward to reading more about diagrams.
Yes, I think “You Can Count on Monsters” was one of the influences that prompted me to make these.
Lovely!
In college, there was a poster with different Pascal Triangles, each of them highlighting the multiples of different prime numbers. The patterns were beautiful. And they are really easy to generate, I created a Logo program for it (I didn’t have Brent’s graphics library 😉 and used it in an algorithms class.
Oh, very cool idea. I just took a few minutes to hack something up and it’s pretty awesome. Here’s a teaser:
I’ll write a post about it at some point soon.
I wonder if you can see the patterns in the first 36 numbers better if you don’t reverse the factors. (I can’t get cairo installed with ghc 7.6.1…)
Yes, I’ve considered this. I’ll give it a try.
gtk2hs is known not to compile under 7.6.1. Or do you really mean cairo itself? It would probably help if I split the diagrams-cairo package into two: one that depends just on cairo and another (diagrams-gtk) that depends on all of gtk2hs. I plan to do that soon. In the meantime you can also try the diagrams-svg backend.
I meant gtk2hs indeed. diagrams-svg worked after editing some cabal files and replacing old-time with time. Here are the first 100 numbers with unreversed factors and colored circles: https://dl.dropbox.com/u/205768/factorDiagram.svg (It’s 3.7MB because the circles are serialized as svg paths.)
Cool! Hehe, yeah, diagrams-svg needs some optimization work…
My wife pointed out that every prime is a circle on its own, except two. Groups of four are not shown as two circles of two, but instead one group of four. That makes speedy factoring a bit confusing.
Yes, two is a bit special. I don’t understand the distinction though, what’s the difference between “two circles of two” and “one group of four”? What would the former look like?
If you start with two non-overlapping circles and then put two circles in each, they can never be as close together as in the square group of four.
In other words, you cannot draw non-overlapping circles around groups of two in the square group of four.
Yes, that’s exactly it. For both of us the pattern was broken when four circles were equal spacing from each. Circles around any other groups could not overlap, exactly as Jan van Lent says.
The svg generated from the javascript D3 library does two differently, more like two separate groups.
You may be interested in Lost Lander’s “Wonderful World”. The music video is made out of geometric creatures merging, and the whole thing is based on prime factorization as well. It’s wonderfully animated: http://www.youtube.com/watch?v=TZkQ65WAa2Q
Amazing!!! Thanks for sharing!
This is a good way to visualize integer factorization. Great work!
As usual, you’ve done something fascinating with your ability to get something abstract into a visual form.
I like this a lot. It’s beautiful, simple and obvious once you’ve seen it, not before :-).
Any chance you could provide SVGs of some of the images? They’re quite interesting from a design perspective.
Sure, I could make SVGs, but have other things I need to be working on at the moment. I plan to write a followup post sometime in the next week, I’ll make some SVGs and link to them then.
Thank you.
You can get them from http://diagrams.alpmestan.com/ : just enter the number you want, factorize it, and click the “SVG file” link.
> Powers of three are especially fun, since their factorization diagrams are Sierpinski triangles!
Haha, excellent! I like this choice.
Brent, gorgeous use of the diagrams package – and I’m sure you could convince the snap or yesod teams to web-appify the tool
Consider having primelayout *rotate* the p copies of the base image around the center of the circle, rather than translating. It would make things more radially symmetric (numbers 10 and 30 would look a lot nicer), but would not change the result for prime powers (for prime powers, rotating and translating would have the same effect due to dihedral symmetry).
Yes, this is an excellent idea! Someone else already suggested this, though I was worried about the prime powers — but now that I think about it more, you’re absolutely right about the symmetry. I’m already planning a follow-up post sometime next week with improved versions of the diagrams and a collection of related links and such that various people have contributed.
One thought that *might* help wrangle larger prime factors is if you nest concentric rings. This idea deviates from the general rule you’ve established, but it might at least help in some cases.
For example 21 wouldn’t be seven triples in a ring, it’d be three concentric rings of seven dots.
Two motivations. 1) To use up some of that empty space in the middle of eg 611. 2) It’s easier to count the number of nestings (presumably linearly along a radius) instead of around the circle. On the other hand, it might be harder to count the number of dots in a ring versus the number of compound structures in a ring.
Awesome stuff!
Hmm, interesting idea, though one big difficulty I forsee with this is that the layout algorithm is no longer purely a fold over the list of prime factors. I do plan to release some more generic code (as a module for the diagrams-contrib package) which should make it easier for people to play around with ideas like this. In the meantime I’ve also come up with (what I think is) a nice use of color to make it eas(ier) to interpret diagrams for numbers like 611. Stay tuned. =)
Try drawing a ring of sub-diagrams by rotate each sub-diagram so they all point “inward” to the centre. Apply this recursively.
This is just absolutely beautiful.
Here’s a version written using JavaScript and SVG: http://www.jasondavies.com/factorisation-diagrams/
Cool, thanks! I’ve been a big fan of your work for a while, so I’m happy you noticed this. =)
Pingback: Factor diagrams « The Bayesian Observer
Excellent idea.


I was going to make the same suggestion of rotating the pattern as it is being duplicated.
To avoid getting straight line patterns you can deal with 2 as a special case as above or you can rotate the pattern before duplicating.
I prefer the straightforward implementation though.
There is no need to only consider sorted lists of primes.
I implemented something using Maple, exported to eps, cleaned up using Ghostscript and converted to SVG using pstoedit.
Two examples:
https://dl.dropbox.com/u/100280700/23456.svg
https://dl.dropbox.com/u/100280700/65432.svg
The SVG files are big.
Same as png:
It would be good exercise to code this directly in Postscript.
A nice web service could dynamically generate pictures based on a URL with a base 36 filename representing a list of integers.
A complete diagram with for each integer all the patterns for all possible factorisations (including ordering) might be interesting.
The geometry I used might be slightly different than in the original.
I used the idea of bounding circles.
Start of with a pattern contained in a unit circle.
Rescale, translate and then rotate n times so that the n new circles have their centre on the unit circle and are packed tightly. Then rescale the whole thing so that it fits again into a unit circle. Repeat.
The examples use a disk of radius 0.5 as the starting pattern.
Very nice, thanks for sharing!
Pingback: 인수분해 그림과 프랙탈 « Hav fuN with Math
I’d like to suggest that 7 be special-cased to hexagonal close packing.
Actually, I think that 2 and three should be the special cases, with 4 implied from the flip-flop of case 2.
Then all the other n (prime) should be laid out with a central item and (n-1) surrounding items, possibly even enhanced to have multiple rings of surrounding items.
ie.
* when n = (1+3i) and i > 3
have a central item, an inner ring of i items and an outer ring of 2i items
* when n = (1+4i) and i > 3
have a central item, an inner ring of i items and an outer ring of 3i items
* when n = (1+6i) …
I’m sure there’s some better pattern here but I’m not mathematician enough to know it
Pingback: Qualche triangolo « Con le mele | e con le pere
LOVE IT! This is such a fun post, and those diagrams are so cute, I was also motivated to re-implement this one for myself. I took mikero’s rotation suggestion, but thought I’d add one more little observation. If you sort your prime factors going inward from large to small instead of small to large, the overall result has a slightly different aesthetic. I feel like maybe they’re easier to read on the whole, if I’m actually trying to mentally look at a number and quickly ‘read’ the entire set of prime factors.
https://dl.dropbox.com/u/364079/factorgrams-l2s.pdf – vs –
Click to access factorgrams-s2l.pdf
—
David.
Pingback: Visto nel Web – 48 « Ok, panico
Pingback: Visualizing Pascal’s triangle remainders | The Math Less Traveled
I have created a page that animates transitions from the factorisation diagram of one number to the factorisation diagram of its successor. Implemented in JavaScript using the Raphaël library
http://seanseefried.com/factor-diagrams/
Pingback: Skaitļu maģija 1 « prometejs
Pingback: Animated Factorisation Diagrams | Richer Ramblings
Pingback: La danza de los factores « :: ZTFNews.org
Pingback: Factorization Dance, Vanishing, and Storm Infographics « Math Munch
Pingback: More factorization diagrams | The Math Less Traveled
Pingback: Factorizando números visualmente « Noticias sobre economia digital
Pingback: Factorizando números visualmente | Noticias CEU
Pingback: Dancing Factorization Diagrams | Visual Loop
Pingback: La danza de los factores | Blog del Departamento de Álgebra
We’ve implemented this for SymPy Gamma: http://gamma.sympy.org/input/?i=140
This uses D3.js for rendering and SymPy/Python in the backend.
This is the best idea about integer factorization, written here is to let more people know and participate.
A New Way of the integer factorization
1+2+3+4+……+k=Ny,(k<N/2),"k" and "y" are unknown integer,"N" is known integer.
How do I know "k" and "y"?
"P" is a factor of "N",GCD(k,N)=P.
Two Special Presentation:
N=5287
1+2+3+…k=Ny
Using the dichotomy
1+2+3+…k=Nrm
"r" are parameter(1;1.25;1.5;1.75;2;2.25;2.5;2.75;3;3.25;3.5;3.75)
"m" is Square
(K^2+k)/(2*4)=5287*1.75 k=271.5629(Error)
(K^2+k)/(2*16)=5287*1.75 k=543.6252(Error)
(K^2+k)/(2*64)=5287*1.75 k=1087.7500(Error)
(K^2+k)/(2*256)=5287*1.75 k=2176(OK)
K=2176,y=448
GCD(2176,5287)=17
5287=17*311
N=13717421
1+2+3+…+k=13717421y
K=4689099,y=801450
GCD(4689099,13717421)=3803
13717421=3803*3607
The idea may be a more simple way faster than Fermat's factorization method(x^2-N=y^2)!
True gold fears fire, you can test 1+2+3+…+k=Ny(k<N/2).
More details of the process in my G+ and BLOG.
Can I include your diagrams in this collection? I think I will make a separate “chapter” there for factorization diagrams: http://mathfuture.wikispaces.com/SubQuan+and+friends
Yes, of course! And be sure to also take a look at https://mathlesstraveled.com/2012/11/05/more-factorization-diagrams/ which has some improved diagrams.
Pingback: Factoritzar… multiplicar… « Al nostre ritme
Reblogged this on conlatio and commented:
A program to generate “factorization diagrams”.
Pingback: This Beautiful Visualization Makes Prime Factors Dance | Smart News
Pingback: Delicious Bookmarks for January 7th through January 8th « Lâmôlabs